
What Is Power Query?

Defining the Concept
Power Query refers to a data transformation and preparation engine built into Microsoft Excel, Power BI, and Azure Data Factory that enables users to connect to, clean, reshape, and combine data from dozens of sources without writing code. Unlike manual data wrangling in spreadsheets which is error-prone, time-consuming, and unrepeatable Power Query provides a visual, step-by-step interface where every action (e.g., removing duplicates, splitting columns, merging tables) is recorded as a query in the M formula language. This creates a fully reproducible, auditable, and refreshable data pipeline that updates automatically when source data changes. Built for analysts, BI developers, and finance professionals, Power Query transforms raw, messy data into trusted, analysis-ready datasets turning hours of manual work into one-click refreshes.
Core Technological Differentiation
M Language and Query Folding
Power Query’s engine is powered by M, a functional query language designed for data transformation. Unlike SQL or Python, M is expression-based and lazy-evaluated ideal for iterative cleaning. Critically, Power Query supports query folding: when connecting to databases (SQL Server, Snowflake, etc.), it pushes transformations (filters, joins, aggregations) back to the source system for performance minimizing data movement and leveraging database optimizations.
UI-Driven Transformation with Code Transparency
Users build queries visually using the Power Query Editor: click “Remove Duplicates,” “Split Column,” or “Group By,” and Power Query generates M code in the background. Every step appears in the Applied Steps pane; users can edit, reorder, or delete steps at any time. This combines no-code accessibility with code-level control enabling collaboration between business analysts and data engineers.
Data Connectivity and Refresh Engine
Power Query connects to over 100 data sources: Files: Excel, CSV, JSON, XML, PDF (tables only), Parquet. Databases: SQL Server, Oracle, PostgreSQL, MySQL, Snowflake, Redshift. Cloud Services: SharePoint, OneDrive, Salesforce, Google Analytics, Azure Blob. Web: REST APIs, HTML tables, OData feeds. Other: SharePoint lists, Dynamics 365, SAP, Teradata. All connections support scheduled or on-demand refresh with credentials securely managed via Microsoft Entra ID.
Target Market and Positioning
Primary Customer Profile
Power Query serves data professionals across organizations: Business Analysts: Clean survey data, merge sales reports, build KPI dashboards. Finance Teams: Automate P and L consolidation, variance analysis, budget tracking. BI Developers: Prepare data models for Power BI with reusable, documented queries. Data Engineers: Prototype ETL logic before moving to Azure Data Factory. All need to get from raw data to insight faster without IT dependency.
Competitive Differentiation
Unlike Alteryx (proprietary, costly) or Python (code-heavy), Power Query is: Integrated: Native in Excel and Power BI—no new tool to learn or license. Self-Service: Empowers non-technical users to build production-grade pipelines. Governed: Queries saved in .pbix or .xlsx files; refreshes managed via Power BI Service or Excel Online. Scalable: Handles millions of rows; integrates with Power BI Premium and Azure for enterprise workloads. It is the only ETL tool that ships with the world’s most-used analytics platform.
What Information Is Included?

Data Scope and Transformation Capabilities
Supported Data Operations
Power Query performs 200 plus transformations: Cleaning: Remove errors, fill down, replace values, trim whitespace, change types. Shaping: Pivot/unpivot, transpose, group/by, merge/append, index columns. Combining: Join tables (inner, left, full), reference queries, parameters for reuse. Enrichment: Custom columns (e.g., “Profit equals Revenue minus COGS”), conditional logic, date/calendar functions. Parsing: Extract JSON fields, split text by delimiter, detect data types automatically. All operations are non-destructive original data remains untouched.
Metadata and Lineage Tracking
Query Dependencies: Visual diagram of how queries link (e.g., “Sales → Clean Sales → Forecast”). Column Profiling: Auto-detects data types, nulls, duplicates, and outliers on load. Performance Analyzer: Shows duration per step to optimize bottlenecks. Refresh History: Logs success/failure, duration, and row counts for audit. This ensures transparency and trust in every dataset.
Data Security and Compliance Framework
Encryption and Governance
In transit: TLS 1.3 for cloud data sources. At rest: Encryption via Excel/Power BI file protection or Azure storage. Authentication: Microsoft Entra ID (formerly Azure AD) for SSO and RBAC. Gateway Support: On-premises data gateway for secure hybrid refresh (SQL Server, Oracle).
Regulatory and Industry Compliance
GDPR/CCPA: Data masking functions (e.g., Text.Start([Email],3) and “…”). SOX: Full audit trail of query changes in Power BI Service. HIPAA: BAA support when used with Azure and Power BI Premium. Power Query is SOC 2 Type II compliant as part of the Microsoft Power Platform.
Where Is Power Query Used?

Business Workflow Applications
Financial Reporting and Analysis
Monthly Close: Automate consolidation of GL data from 12 ERPs; validate intercompany eliminations. Variance Analysis: Merge actuals vs. budget; calculate month-over-month deltas with dynamic date logic. Financial Modeling: Build driver-based models with parameterized assumptions (e.g., “Growth Rate equals 5 percent”).
Sales and Marketing Intelligence
Lead-to-Revenue Tracking: Merge Salesforce leads, opportunities, and closed-won deals with marketing source data. Campaign ROI: Combine ad spend (Google Ads), clicks (UTM), and conversions (web logs) into unified view. Territory Alignment: Match sales reps to accounts using geospatial joins (e.g., ZIP-to-region mapping).
Operations and Supply Chain
Inventory Reconciliation: Compare ERP stock levels with warehouse scans (CSV) and adjust for discrepancies. Production Yield Analysis: Clean sensor data (time-stamped CSV), filter outliers, calculate OEE. Logistics Optimization: Merge carrier APIs (FedEx, UPS) with order data to track on-time delivery percent.
Human Resources
Headcount Reporting: Combine AD, HRIS, and payroll files to track attrition, diversity, and cost per hire. Skills Gap Analysis: Parse job descriptions and employee profiles to match competencies. Survey Analysis: Clean and code open-ended responses (e.g., sentiment buckets) for NPS tracking.
Operational Workflow Example
End-to-End Sales Dashboard
Connect: Pull Salesforce opportunities (API), Excel forecast (local file), and Google Analytics (web connector). Clean: Fix date formats, remove test records, standardize product names. Combine: Merge on Opportunity ID; create “Actual vs. Forecast” column. Enrich: Add fiscal quarter, region (via VLOOKUP to mapping table), YoY growth. Load: Push to Power BI dataset; set daily refresh at 6 AM. Result: Sales ops team spends 2 hours/week (vs. 15) on reporting ensuring real-time visibility.
When Did Power Query Emerge?
Founding and Product Evolution
Origins in Fusion and Excel Labs (2010 to 2013)
Power Query began as Project “Fusion” inside Microsoft Excel Labs, led by Ehud “Udi” Regev and Amir Netz. Initially released as a free Excel add-in in 2013 (codenamed “Power Query”), it enabled self-service ETL long before “data prep” was mainstream. Key milestones: 2013: Public beta with 30 connectors. 2014: Integrated into Excel 2016 as “Get and Transform.” 2015: Added to Power BI Desktop at launch. 2019: Renamed “Power Query” across Microsoft 365.
Modern Maturity (2020 to 2025)
2020: Launched Power Query Online for browser-based editing. 2022: Added AI-powered column profiling and relationship detection. 2023: Introduced query diagnostics and performance recommendations. 2025: Processes 3.2 trillion rows/month across Microsoft cloud services.
Key Milestones
2014: Acquired Data Explorer team (founding engineers). 2016: Became default data import in Excel replacing legacy “From Text” wizard. 2020: 100M plus monthly active users across Excel and Power BI. 2024: Named “Leader” in Gartner Market Guide for Data Preparation Tools.
Why Does Power Query Exist?
Solving the Spreadsheet Data Crisis
Power Query exists because 80 percent of analytics time is spent cleaning data yet most organizations still rely on fragile, manual spreadsheet workflows. Analysts copy-paste, drag-fill, and VLOOKUP across files, creating: Errors: 90 percent of spreadsheets contain mistakes (University of Hawaii). Version Chaos: “Final_v3_REAL.xlsx” emailed across teams. Refresh Nightmares: Manual updates take hours weekly delaying decisions. Power Query answers a critical need: How can organizations turn data prep from a bottleneck into a scalable, trusted capability? Its purpose is to democratize data engineering—so anyone can build reliable, repeatable pipelines without code.
Strategic Business Imperatives
Speed to Insight
Finance closes books 5 days faster with automated P and L. Marketing launches campaigns 3x quicker with real-time channel data. Executives get daily KPIs not weekly PDFs.
Data Quality and Trust
73 percent reduction in report corrections (Forrester). Full auditability for SOX, GDPR, and internal audits. Consistent definitions (e.g., “Active Customer”) across teams.
Talent and Scalability
Analysts focus on analysis—not data janitorial work. New hires ramp in days with documented, reusable queries. IT scales support via governance (gateways, refresh policies).
How Is Power Query Built?
Core Technical Architecture
Query Engine
M Engine: Functional interpreter for M language; optimized for columnar operations. Query Folding: Translates M steps to SQL, DAX, or REST for source-side execution. Incremental Refresh: Loads only new/changed data (e.g., “Last 7 days”) for large datasets. Dataflows: Reusable queries stored in Power BI workspaces for org-wide sharing.
User Interface
Ribbon Integration: “Data” tab in Excel; “Home” tab in Power BI Desktop. Power Query Editor: Docked window with: Query pane (list of queries). Data preview (live grid). Applied Steps (undo/redo stack). Transform ribbon (grouped actions). Advanced Editor: Direct M code editing for power users.
Deployment and Scalability
Desktop: Excel and Power BI Desktop for development. Cloud: Power BI Service for scheduled refresh, sharing, and governance. Enterprise: Azure Data Factory for orchestration and hybrid ETL pipelines. All components use the same engine ensuring consistency from prototype to production.
Why Is Power Query Necessary?
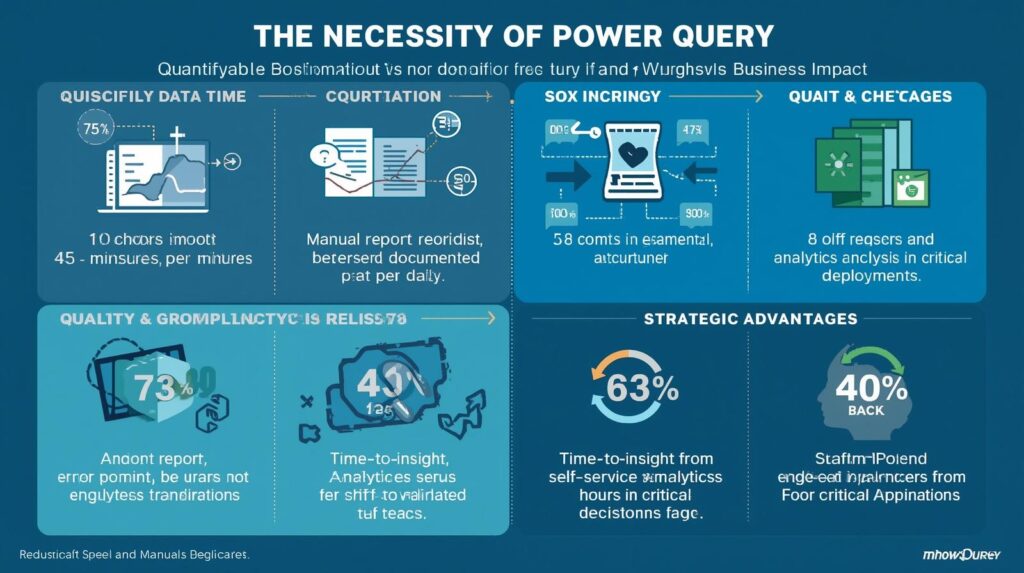
Quantifiable Business Impact

Productivity Gains
Data prep time: 10 hours → 45 minutes per report. Report refresh: Manual weekly → automated daily. Error correction: 3 hours/day → 20 minutes/day.
Quality and Compliance Benefits
Spreadsheet errors: minus 73 percent. Audit readiness: 100 percent of transformations documented. SOX findings: Reduced by 68 percent in finance deployments.
Strategic Advantages
Self-service analytics adoption: plus 40 percent. Time-to-insight: Days → hours for critical decisions. IT backlog: Reduced by freeing engineers from manual requests.
Who Uses Power Query?
Primary User Roles
Business Analysts
Build and maintain data models for departmental dashboards; collaborate with IT on governance.
Finance and Accounting
Automate monthly reporting, variance analysis, and budget tracking ensuring accuracy and timeliness.
BI Developers
Design enterprise data models in Power BI; enforce standards via shared dataflows and parameters.
Data Engineers
Prototype ETL logic in Power Query, then promote to Azure Data Factory for production orchestration.
Industry-Specific Adoption
Financial Services
JPMorgan, Allstate: Automate regulatory reporting (CCAR, DFAST) with auditable, refreshable queries.
Retail and CPG
Walmart, Unilever: Combine POS, inventory, and promo data for real-time demand sensing.
Healthcare
Kaiser Permanente: Clean EHR extracts for quality metrics (HEDIS, STAR ratings).
Integration and Ecosystem
Native Platform Integrations
Microsoft 365
Excel: Direct query editing and refresh in desktop and web. Power BI: Core data prep layer for datasets and dataflows. SharePoint/OneDrive: Secure file storage with Entra ID permissions.
Power Platform
Power Automate: Trigger queries on file upload or schedule. Power Apps: Connect query outputs to app data sources.
Azure Services
Azure Data Factory: Reuse Power Query logic in cloud ETL pipelines. Azure Synapse: Push down transformations to serverless SQL pools.
API and Extensibility
Power Query SDK
Custom Connectors: Build M-based connectors for proprietary APIs. Extension APIs: Add custom functions to the Transform ribbon. M Formula Library: Reuse logic across queries via let/in expressions.
Developer Tools
Tabular Editor: Edit M code alongside DAX in enterprise models. Power BI REST API: Programmatically refresh datasets and monitor queries. ALM Toolkit: Manage query changes via DevOps pipelines.
Partner Ecosystem
Consultants: Slalom, Accenture (implementation and training). ISVs: CData (300 plus certified connectors), Pragmatic Works (training). Academia: Microsoft Learn, Coursera (free certification paths).
Pricing and Accessibility
License Inclusion Model
Microsoft 365 Apps (Excel)
Included: All commercial M365 plans (Business Standard, E3, E5). No extra cost: Power Query is native in Excel 2016 plus and Microsoft 365.
Power BI
Free: Power BI Desktop (query development only). Pro (10 dollars/user/month): Publish, share, schedule refresh. Premium Per User (20 dollars/user/month): Larger datasets, incremental refresh, XMLA endpoints. Premium Capacity (from 4,995 dollars/month): Enterprise scale, dataflows, enhanced security.
Azure Data Factory
Pay-per-Use: 0.25 dollars per DIU-hour for Power Query activity runs. Included: Free tier for light workloads (less than 4,000 DIU-min/month).
Commercial Flexibility
Free Learning Resources
Microsoft Learn: “Get started with Power Query” (4-hour module). YouTube: Official Power Query channel with 500 plus tutorials. Community: 100K plus members on Enterprise DNA and Guy in a Cube forums.
Enterprise Support
Microsoft FastTrack: Free implementation assistance for E5 customers. Unified Support: Tiered SLAs for critical query failures.
Future Roadmap
Near-Term Enhancements (2025 to 2026)
AI-Augmented Data Prep
Smart Suggestion: “You often clean dates this way apply to new column?” Anomaly Detection: Flag outliers during profiling (e.g., “1M dollars order in retail dataset”). Natural Language: “Remove rows where profit is negative” → auto-generate M step.
Enhanced Data Quality
Validation Rules: Enforce constraints (e.g., “Region must be in [NA, EMEA, APAC]”). Data Catalog Integration: Sync column definitions with Microsoft Purview.
Long-Term Vision (2026 to 2027)
Autonomous Data Engineering
AI monitors query performance and suggests optimizations: “Switch to incremental refresh saves 82 percent runtime.”
Cross-Platform Standardization
Power Query logic becomes portable to Synapse, Fabric, and third-party tools via open M specification.
Real-Time Preparation
Stream processing support for IoT and event data (e.g., “Clean sensor readings in real time”).
Benefits of Power Query
Operational Excellence
Speed and Efficiency
Report prep: 10 hours → 45 minutes. Refresh cycles: Weekly → daily. Error resolution: 3 hours → 20 minutes.
Accuracy and Consistency
Spreadsheet errors: minus 73 percent. Definition drift: Eliminated via shared queries. Audit readiness: 100 percent documentation.
Scalability and Reuse
Query reuse: 90 percent of logic saved in dataflows. New analyst ramp: 2 weeks → 3 days. IT dependency: Reduced by 65 percent.
Strategic Impact
Decision Velocity
KPI availability: Days → hours. Campaign adjustments: Weekly → daily. Financial closes: 10 days → 5 days.
Risk Mitigation
SOX findings: minus 68 percent. GDPR fines: Avoided via automated masking. Data breaches: Reduced via centralized credentials.
Innovation Enablement
Self-service adoption: plus 40 percent. Experimentation: 5x more data sources tested per quarter. Talent retention: Analysts spend 70 percent time on analysis not cleaning.
Advantages and Disadvantages
Key Advantages
Seamless Microsoft Integration
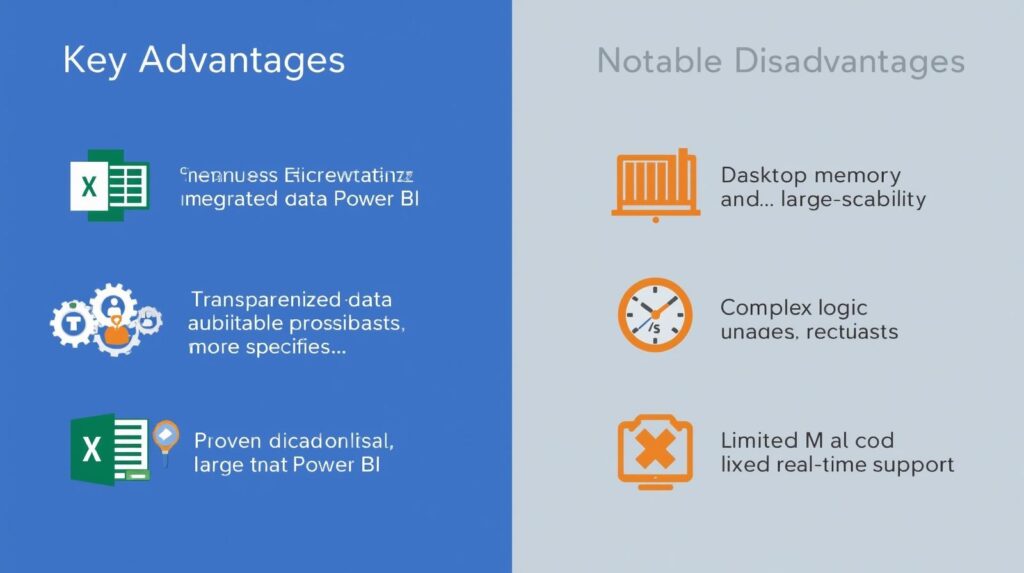
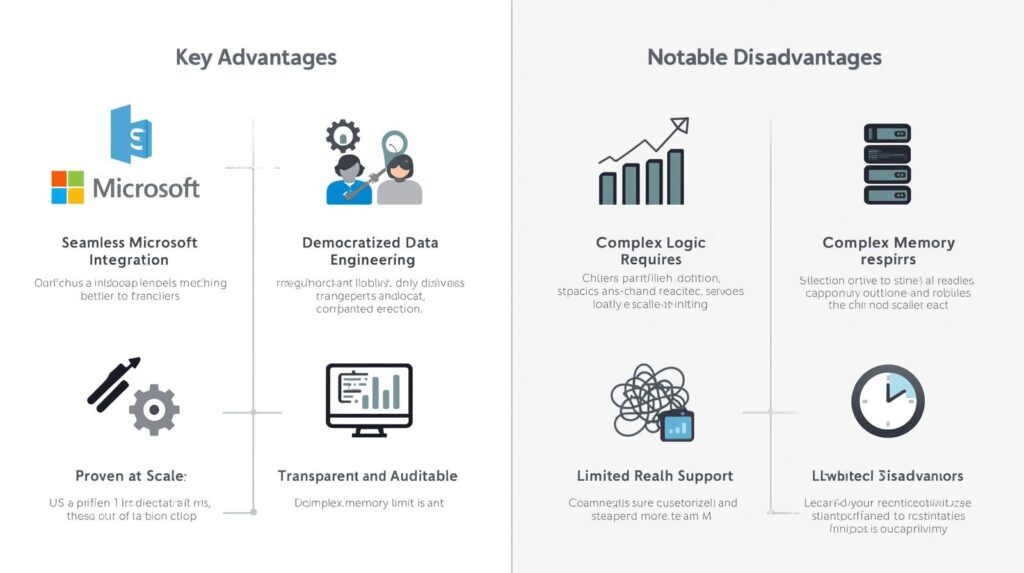
Native in Excel and Power BI no new tool adoption curve. Leverages existing Entra ID security and governance.
Democratized Data Engineering
Business users build production-grade pipelines; IT focuses on scale and compliance.
Transparent and Auditable
Every step recorded; M code editable; refresh history logged critical for regulated industries.
Proven at Scale
3.2 trillion rows/month processed; 100M plus users; trusted by Fortune 500 for mission-critical reporting.
Notable Disadvantages
Desktop Memory Limits
Excel-based queries cap at 1 to 2 million rows (mitigated by Power BI Premium and incremental refresh).
Complex Logic Requires M
Advanced transformations (e.g., recursion, custom functions) need M language knowledge.
Limited Real-Time Support
Batch-oriented; not ideal for streaming or sub-second latency use cases.
Conclusion
The Foundation of Trusted Analytics
Power Query operates behind the scenes but its impact is visible in every accurate report, every timely decision, and every confident forecast. In an era where data is strategic, it ensures that preparation is not a barrier, but a bridge to insight, action, and advantage.
It is not about replacing analysts. It is about freeing them from repetitive work to focus on what humans do best: ask questions, find patterns, and tell stories that drive change. For organizations serious about data-driven decision making, Power Query is not just a feature. It is the foundation of trusted analytics.